How often do you swing through a drive-thru? The cost of fast food may be hitting your wallet harder than you think.
The cost also likely varies depending on where you live — and a recent study by WalletHub looked to see which states spend the largest portion of their income on quick-service food.
“With fast food prices rising by an average of 47% over the past decade, it’s fair for consumers to wonder whether the convenience of having food in minutes is really even worth it anymore,” said WalletHub analyst Chip Lupo in a press release. “Where you live can have a big impact on how much you shell out for fast food, too; it costs around 1.6 times more in the most expensive states than the cheapest states, relative to the median income.”
Why is the country’s largest In-N-Out restaurant in ‘the middle of nowhere’?
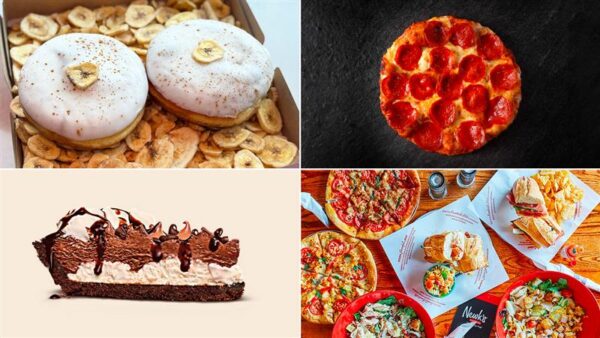
To determine where fast food costs people the most, WalletHub’s team analyzed the prices of fast-food burgers, pizza and fried chicken sandwiches in each of the 50 states. The total local cost of one burger, one pizza and one fried chicken sandwich were then compared to the median household income in each state.
The results suggest that residents of Mississippi and New Mexico might be spending the most of their income (0.47%) on the foods included in the study, while those in New Jersey and Massachusetts spend the least (0.30%).
Here’s how the 50 states ranked:
States That Spend the Most & Least on Fast Food
| Overall Rank* | State | Cost of Fast Food as a Share of Median Monthly Household Income |
|---|---|---|
| 1 | Mississippi | 0.47% |
| 2 | New Mexico | 0.47% |
| 3 | Kentucky | 0.46% |
| 4 | Arkansas | 0.45% |
| 5 | West Virginia | 0.44% |
| 6 | Louisiana | 0.44% |
| 7 | Alabama | 0.43% |
| 8 | Montana | 0.43% |
| 9 | Oklahoma | 0.42% |
| 10 | Vermont | 0.42% |
| 11 | Florida | 0.41% |
| 12 | South Carolina | 0.41% |
| 13 | Maine | 0.40% |
| 14 | Arizona | 0.39% |
| 15 | Missouri | 0.38% |
| 16 | Indiana | 0.38% |
| 17 | Tennessee | 0.38% |
| 18 | Nebraska | 0.38% |
| 19 | Ohio | 0.38% |
| 20 | Michigan | 0.38% |
| 21 | Kansas | 0.37% |
| 22 | Wisconsin | 0.37% |
| 23 | New York | 0.37% |
| 24 | Alaska | 0.37% |
| 25 | North Dakota | 0.37% |
| 26 | South Dakota | 0.37% |
| 27 | Iowa | 0.37% |
| 28 | Rhode Island | 0.36% |
| 29 | Illinois | 0.36% |
| 30 | Oregon | 0.36% |
| 31 | North Carolina | 0.36% |
| 32 | Wyoming | 0.36% |
| 33 | Georgia | 0.36% |
| 34 | Nevada | 0.35% |
| 35 | Pennsylvania | 0.35% |
| 36 | California | 0.35% |
| 37 | Hawaii | 0.35% |
| 38 | Idaho | 0.34% |
| 39 | Texas | 0.34% |
| 40 | Delaware | 0.33% |
| 41 | Washington | 0.33% |
| 42 | Colorado | 0.32% |
| 43 | Virginia | 0.31% |
| 44 | Maryland | 0.31% |
| 45 | Minnesota | 0.31% |
| 46 | New Hampshire | 0.30% |
| 47 | Utah | 0.30% |
| 48 | Connecticut | 0.30% |
| 49 | New Jersey | 0.29% |
| 50 | Massachusetts | 0.29% |
Credit: WalletHubPop-Tarts bringing back fan-favorite flavor after six-year hiatus
It’s important to note, however, that states with higher percentages of fast-food costs may not be purchasing more fast food than those at the lower end of the list. Mississippi’s ranking, for instance, was influenced by its low median household income, which means the cost of a single pizza, or a chicken sandwich, could take a bigger bite out of its residents’ monthly expenses.
Jessica Holmes’ homemade arayes: Crispy stuffed pitas the whole family will love
Cooking at home may be a cheaper option, analysts say, but it’s not necessarily easier. And it’s definitely not a trend the fast food chains are pushing.
“People are bombarded with advertisements for various fast food options throughout the day,” Jennifer Logan, a professor of economics with Southern Arkansas University, said in a statement included with WalletHub’s report. “Individuals with hectic schedules may find it a challenge to avoid overspending in return for the convenience of fast food.”